The Ultimate Trading Strategy: Master Market Structure & Liquidity
I've developed a strategy that delivers consistent wins while keeping risk to a minimum. The best part? It works across stocks, forex, crypto, and commodities—because all markets follow the same fundamental principles.
By the end of this guide, you’ll not only understand the strategy, but you’ll also be able to apply it confidently to your own trades.
Understanding Market Structure: The Foundation of Every Chart
Before we dive into the strategy, you need to master market structure. Every financial market moves in a predictable way, following three distinct phases:
- Uptrend → Price is making higher highs (HH) and higher lows (HL). Buyers are in control.
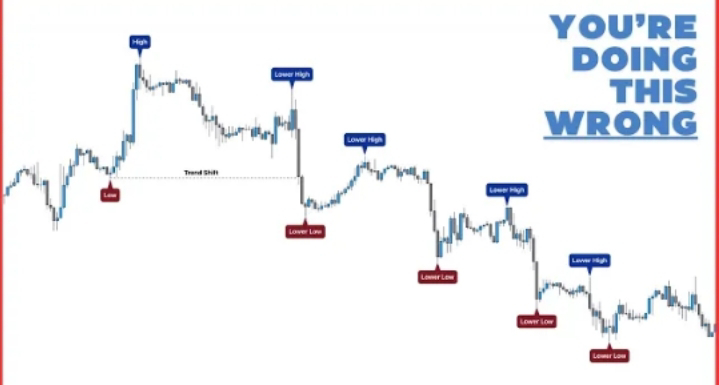
- Downtrend → Price is making lower highs (LH) and lower lows (LL). Sellers are in control.
- Consolidation → Price moves sideways between a defined range, creating equal highs and equal lows.
How to Identify Trends in Real Time
It’s easy to spot an uptrend or downtrend after it has already happened, but real-time trading is different. This is why traders often make mistakes.
To avoid confusion, follow this simple structure rule:
- An uptrend remains valid as long as price does not break the previous higher low (HL).
- A downtrend remains valid as long as price does not break the previous lower high (LH).
When the price breaks the last HL in an uptrend, it signals a trend reversal into a downtrend. The same applies in reverse.
This is how market structure shifts between trends—and if you can recognize it early, you’ll gain a huge edge over most traders.
The Hidden Force Behind Every Market Move: Liquidity
Liquidity is the fuel of the market. Without it, price wouldn’t move.
But what exactly is liquidity? It’s simply pending orders waiting to be executed—specifically, stop-loss orders placed by retail traders.
Traders unknowingly create liquidity pools when they set their stop-losses in predictable locations. This is why price frequently moves to these areas before reversing.
Where Does Liquidity Exist?
- Below support levels → Traders going long place stop-losses below recent lows.
- Above resistance levels → Traders shorting place stop-losses above recent highs.
This creates resting liquidity—a target for smart money.
How Liquidity Drives Market Manipulation
Institutional traders (banks, hedge funds, and market makers) understand liquidity better than anyone. Their goal is to trigger retail traders’ stop-losses to gain liquidity for their own positions.
Here’s how it works:
- Liquidity Grab (Fakeout) → Price briefly breaks a key level, triggering stop-losses.
- Reversal and Expansion → After collecting liquidity, price moves sharply in the opposite direction, leaving retail traders trapped.
This pattern occurs over and over again because retail traders always place their stop-losses in the same places.
The Strategy: Combining Market Structure & Liquidity
Now that you understand market structure and liquidity, let’s put them together into a high-probability trading strategy.
Step 1: Identify the Trend
- Look for a clear uptrend (HH and HL) or downtrend (LH and LL).
- Avoid choppy or unclear markets.
Step 2: Locate Liquidity Pools
- In an uptrend: Look for equal lows (resting liquidity) below price.
- In a downtrend: Look for equal highs (resting liquidity) above price.
Step 3: Wait for a Liquidity Grab (Stop Hunt)
- Let price break into the liquidity pool, triggering stop-losses.
- Many traders will see this as a “breakout,” but we know better—it’s a liquidity grab.
Step 4: Identify a Demand or Supply Zone
- In an uptrend: Find a demand zone (a strong bullish push after consolidation).
- In a downtrend: Find a supply zone (a strong bearish push after consolidation).
Step 5: Enter at the Zone
- Wait for price to return to the demand/supply zone after the liquidity grab.
- Enter a long trade at demand or a short trade at supply.
Step 6: Set Stop-Loss & Take-Profit
- Stop-loss: Place below demand (long trades) or above supply (short trades).
- Take-profit: Set at the previous swing high/low.
Real-World Chart Examples
Let’s apply the strategy step by step:
Example 1: Long Trade Setup
✅ Identify the trend: Uptrend (HH and HL).
✅ Find liquidity: Equal lows form (liquidity below).
✅ Wait for liquidity grab: Price briefly breaks the low, stopping out retail traders.
✅ Identify demand zone: A strong bullish move created a clear demand area.
✅ Enter at demand: Price retests the zone, providing a perfect long entry.
✅ Set stop-loss and take-profit: Stop below demand, take-profit at the previous high.
🎯 Result: A high-probability winning trade with an excellent risk-to-reward ratio.
Example 2: Short Trade Setup
✅ Identify the trend: Downtrend (LH and LL).
✅ Find liquidity: Equal highs form (liquidity above).
✅ Wait for liquidity grab: Price briefly breaks the high, stopping out retail traders.
✅ Identify supply zone: A strong bearish move created a clear supply area.
✅ Enter at supply: Price retests the zone, providing a perfect short entry.
✅ Set stop-loss and take-profit: Stop above supply, take-profit at the previous low.
🎯 Result: A beautiful winning short trade.
Why This Strategy Works So Well
✅ It aligns with market structure → We only trade in clear trends.
✅ It follows liquidity principles → We enter after stop-hunts, not before.
✅ It uses high-probability zones → We trade at demand/supply zones, not random levels.
✅ It offers a high risk-to-reward ratio → Small risk, big potential reward.
Final Thoughts
This strategy is incredibly powerful when used correctly. Here’s how you can implement it:
- Backtest the setup on different markets and timeframes.
- Refine your entries using confluence (candlestick patterns, volume, etc.).
- Master patience—wait for the liquidity grab before entering.
Want more exclusive trading strategies? Follow me on Instagram, where I share insights that don’t make it to YouTube!
Try this strategy and let me know your results. Happy trading!


Comments
Post a Comment